You can add value to your graphs by making use of Social Network Analysis – a group of methods and measures that highlight social relationships in network. This blog post gives an introduction to three of the centrality measures and the value they offer.
Please feel free to leave any feedback in the comments section below.
When to use Social Network Analytics
Before we can understand the different measures, it’s important to establish the types of networks where Social Network Analysis can bring value.
Given they are “social” measures, the networks they’re usually applied to are that involving the interaction of people. This could be a network displaying communications, transactions or even social relationships. The data used in this post is records of email communication at Enron.
Centrality, in the field of Network Analysis, is a concept that is used to identify the relative importance of a node in a given network. Here are the three types of centrality that KeyLines is able to measure:
Degree

Perhaps the most basic measure we use is Degree Centrality. This measure calculates which nodes have the most links in a given network. The more links a node has, the higher the value of degree centrality. This measure is vital in recognising important nodes, as it quickly highlights the players that broadcast and receive a high volume of information.
KeyLines comes fully equipped with a function that measures degree centrality for you. Nodes are resized according to their score, with larger nodes representing higher levels of degree centrality. This quickly makes important nodes visually identifiable in the network.
Betweenness

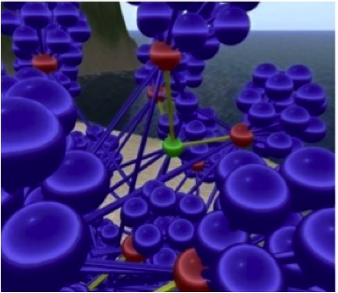
This is a centrality measure which identifies nodes that often appear on the shortest pathway of communication between two other nodes. In other words, high betweenness scores may relate to nodes that relay high volumes of information. In social networks, nodes with high betweenness are often located on the outskirts of two densely populated groups.
Someone with a high betweenness may be useful from a surveillance perspective, for example. If you were to allow your users to drill down to examine the individual data elements, someone with a high betweenness score would be a good place to start because they are likely to have information from disparate parts of the network.
The measure works in the same way, enlarging nodes which have the highest betweenness value.
Closeness

Closeness is a measure that indicates a node’s distance to all other nodes – therefore calculating its reach within the network. Someone with a high closeness score means that they are well connected throughout the network, and could be considered from a targeting perspective. Removing them from the network would cause significant communication problems.
In this diagram, KeyLines’ Closeness tool is demonstrated – larger nodes represent a higher closeness value.
KeyLines also has in-built functionality for measuring kCore, distance and shortest path – keep an eye on our blog in the coming weeks for further explanations of these analytic tools. If you’ve had experience of using SNA features or think that we’re missing anything, let us know in the comments section.
If you would like to know more about KeyLines, please contact us.
The post Social Network Analysis appeared first on .
 The fraud balancing act


 Standard is probably our most popular layout, being a good ‘catch-all’ solution for most kinds of network and any size dataset.
 The Structural layout works in a similar way to the standard layout, but instead of distributing nodes around the chart, it groups similar nodes together. This is done by finding nodes with the same connective structure and fanning them around the parent.
 This layout is great for identifying the nodes which are dependent on the function of others. It rearranges nodes in concentric circles around the subject node, with each ‘generation’ of node forming a new orbit outwards from the parent.
 The hierarchy layout gives both a top-down and bottom-up view on selected nodes. Child nodes are shown in horizontal layers below the parents.
 KeyLines’ incremental layout function works in a slightly different way. It allows you to expand charts by introducing additional data, without affecting the elements already present on your chart.